Performance Testing with JMeter
By Chandima Imalika“An ounce of performance is worth pounds of promises.” -Mae West
In software engineering, the performance of a software is an essential quality attribute as it can completely make the system inefficient and useless.
Performance testing in the sense, give a combined idea of load testing, stress testing, volume testing and capacity testing. Here the first two plays a major role where;
-
Load Testing - How many users the system can handle concurrently without getting slower.
-
Stress Testing - What is the maximum number of users a system can handle without crashing
So without certifying these quality attributes, it’s risky to deploy a software.
So now I’m going to share my knowledge on the basics of software performance testing using Apache JMeter.
Apache JMeter Installation
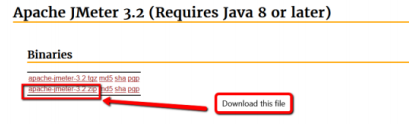
First install Java in your computer and to make sure it has installed properly, type java -version in command prompt. Go to http://jmeter.apache.org/download_jmeter.cgi and download the following zip file.
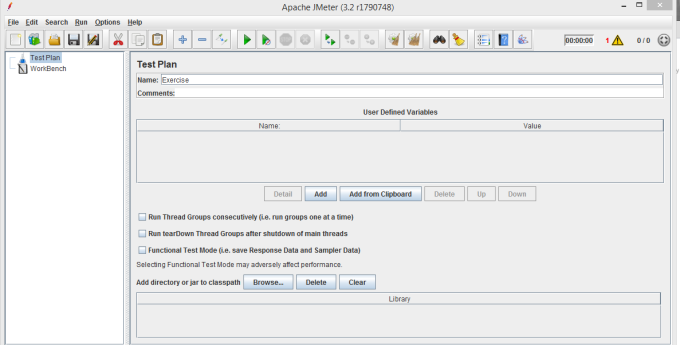
Unzip and save it into a preferred location. To open the JMeter GUI, go inside that folder and then to the bin folder. Open jmeter.bat file and now you can see the following interface, the home page of JMeter.
Let’s Start…
We can begin with the Test Plan. Give a name to it using Name field and save it by going to File>>Save Test Plan as>>FileName.jmx>>Save
Here JMX stands for Java Management Extensions.
Before run the test, fist we have to add the necessary elements to our test plan.
-
Thread Group
-
Sampler
-
Listeners
-
Assertion Groups etc
Thread Group
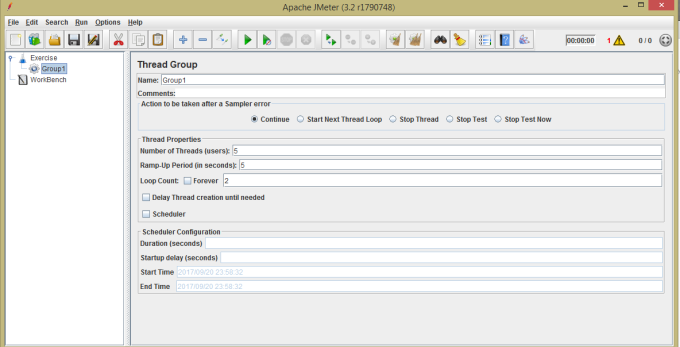
Thread Group is a group of users. We specify how many users we want to use to send concurrent requests to the server. Right click on Test Plan>>Add>>Threads (Users)>>Thread Group
Explanation:-
5 users (Thread Count) send requests to the server, so the second user is sending his request 1 second [5(Thread Count)/5(Ramp-Up Period)] after the first user has been sending and each user is sending the request twice (Loop Count). If the ‘forever’ checkbox is ticked, the test is running until we stop it.
Sampler
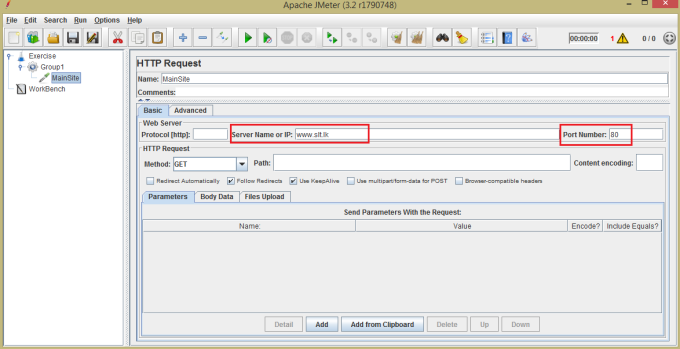
Here we specify that what kind of request the thread groups should send to the server. It can be HTTP, FTP etc. As we are testing a web server, we choose HTTP Request.
Right click on Thread Group>>Add>>Sampler>>HTTP Request
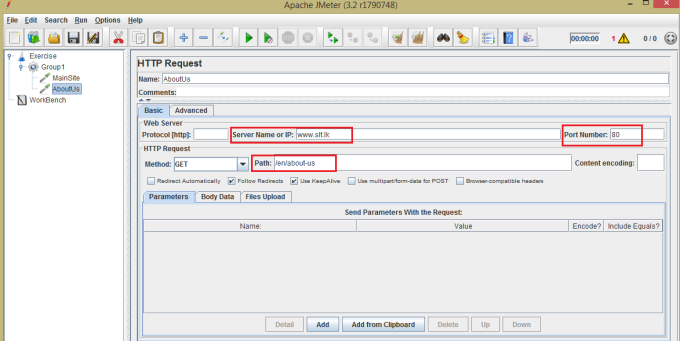
In ‘Server Name’ column we type the URL & the port number of the website that we want to test. If we want to navigate from that base URL, we add that remaining part of the URL in the path field. For example, if I’m going to test Sri Lanka Telecom Website and then navigate to the ‘About Us’ page of it,
- First make one HTTP request “MainSite” including following details;
Server Name or IP: www.slt.lk
Port Number: 80
Path: “keep it empty”
- Then make another HTTP request ‘‘AboutUs” and include following;
Server Name or IP: www.slt.lk
Port Number: 80
Path: //en/about-us
Assertions
Using this element, we can specify the limitations or boundaries which to filter the results.
For example; In Response Assertion, if we type the pattern of the response as 200, the test will pass the responses which contains the response code 200 and fail if another code is there.
Types of Assertions:-
-
HTML Assertion- the test will only pass the HTML responses
-
XML- the test will only pass the XML responses
-
Duration- the test will only pass the responses whose duration obey the rule we specify
-
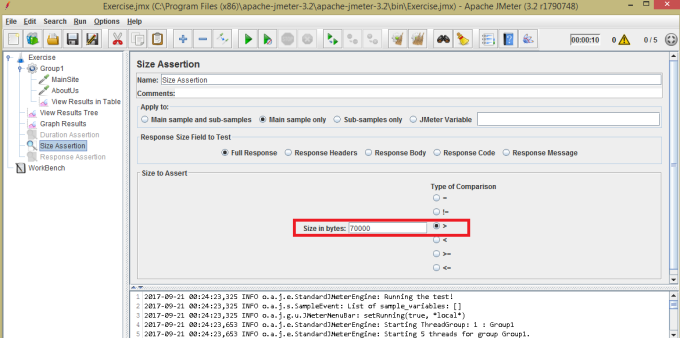
Size- the test will only pass the responses whose sizes obey the rule we specify
-
Response- the test will only pass the responses which includes the response code that we specify here (For example, if we mention 200 as the response code, the test will fail the responses with 404 responses.)
We can disable or enable any type of assertion by right click on it and click “Disable/Enable”.
Listeners
Up to now, we have added thread group to send requests, specify them what kind of request to use and defined the test pass/fail criteria. When the server get the request and send the response, there should be a mechanism to track it and organize the stats to give us a clear idea about how was the journey. Listeners come to the ground for this task.
Right click on Test Plan>>Add>>Listeners>><Listener Type>
There are several types of listeners;
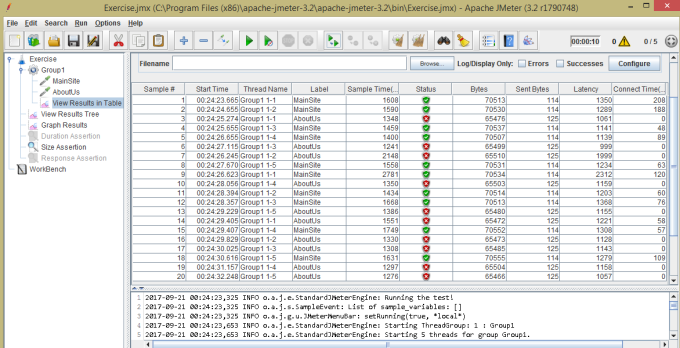
- View Results in Table
Here the responses are displayed in a table specifying the various features of the response; Sample, Start Time, Thread Name, Label, Sample Time, Status, Bytes, Sent Bytes, Latency, Connect Time.
- View Results Tree
Here the responses are displayed in tree view and expanding each record displays the detailed descriptions of the sampler result, request and response data.
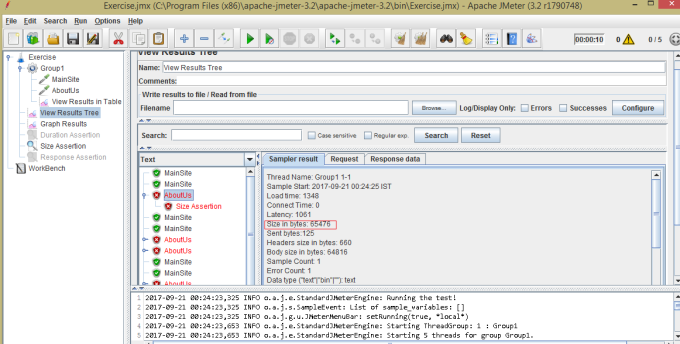
As we have specified the size assertion to 70000 bytes, as this is just 65476 bytes, the test is failing.
- Graph Results
Here the responses are analyzed and presented as a graph. We need mainly the throughput and the deviation to analyze the graph.
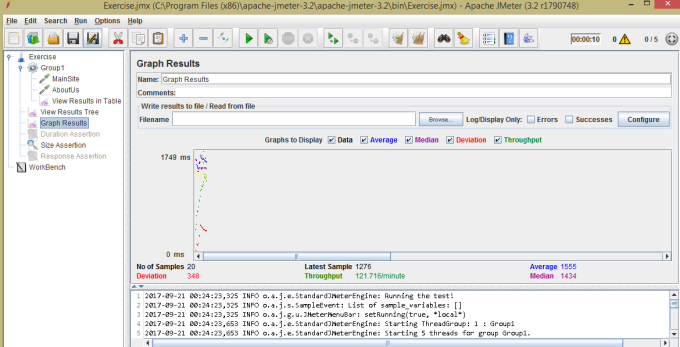
Throughput- It represents the ability of the server to handle heavy load. The higher the Throughput is, the better is the server performance.
Deviation- the deviation from the average. The smaller the better.
Run a Test Plan
Before run the current test plan, make sure you delete all the previous records by clicking on one of these icons(1).
![]()
Then click the ‘Start’ icon (2) or simply press ctrl + r.
(3) icon shows the number of errors in the test and (4)implies how the threads(users) are adding to the test while it is running.
Now we have done most of the basics of Jmeter. There are many more features to explore in JMeter and hope this will give you the base.
I’m also a beginner in JMeter so please feel free to share your feedback and knowledge.
I would like to thank Geveo Australasia for organizing Tech Boost sessions for the new comers to boost up with latest technologies and special thanks to Biman Pathirage for his Tech Boost session on JMeter.
Thank You :)