Profiling mobile apps with Xamarin Profiler
By PriyadharsunIntroduction
Profiling is a kind of dynamic program analysis, which analyzes the program while it is running, and in use. This helps to optimize code and find resource usage that is out of place. A profiler provides insight into the most commonly used parts of your code base, and helps locate areas where you should spend time making improvements. There are two types of profilers available to analyze performance of the mobile applications.
-
Xamarin Profiler for iOS and Android
-
Performance Profiler
The Xamarin Profiler is only available on Enterprise licensing but Performance Profiler is available with lower versions as well. The major advantage of Xamarin Profiler comparing to other tools is that the Xamarin has clear idea about the Mono runtime, which allows for exposing a better view of what is going on as it relates to the actual code you are writing. If you are going to analyze Android apps, you can use Xamarin Profiler on Windows platform. For iOS apps, you can use Xamarin Profiler with Xamarin Studio on Mac OS.
Xamarin Profiler Setup
Download and install Xamarin Profiler from https://www.xamarin.com/profiler .
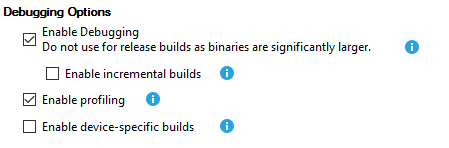
To enable debugging option in the Android Project, Go into the Properties of the Android project, then the Android Options tab,and switch on the Debugging option.
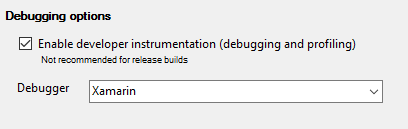
To enable debugging option in the iOS Project, Go into the Properties of the iOS project, and switch on both Debugging & Profiling options.
Working with Xamarin Profile
Once you install the Xamarin Profiler, navigate to the Visual Studio Analyze menu and select Xamarin Profiler. Next, you have to select necessary template to analyze. Following templates are available.
-
All Instruments – Includes all available instruments
-
Allocations - Analyzes the memory usage by tracking object allocations
-
Cycles – Detects reference cycles
-
Memory – Find memory related problems
-
Performance – Find memory and CPU usage performance problems
-
Time Profiler – Profiles a running program on all cores at regular interval
Once chosen, the following screen will present the profiling in real time. This template contains five components such as toolbar, instrument list, Instrument detail area, plot chart, and inspector view.
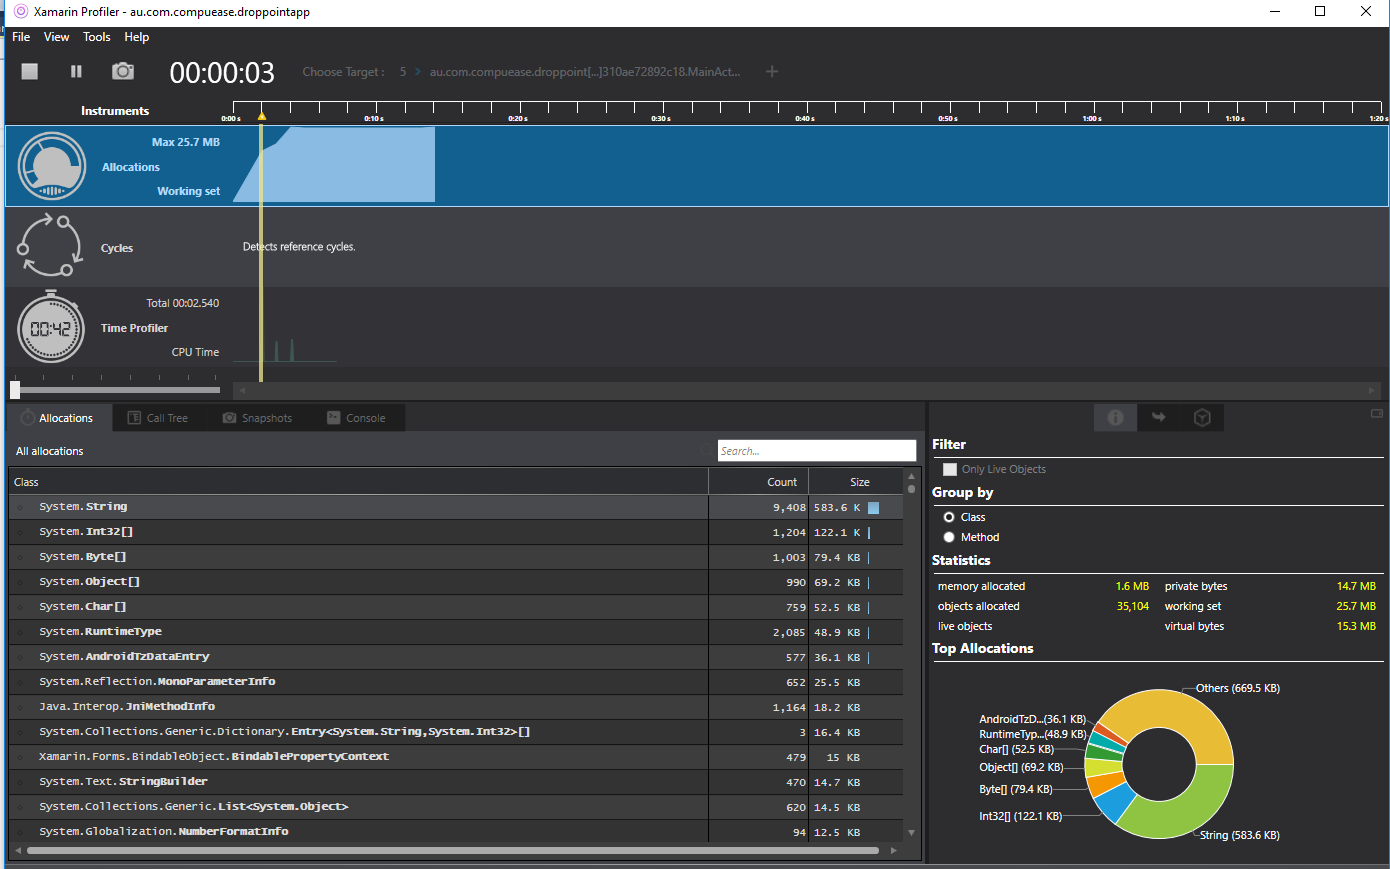
Allocations
The allocations instrument tracks the memory usage of the app. It will show the maximum amount of memory that used by the app, as well as allow you to explore more about into what are objects specifically was making up that memory usage in detailed. The Allocation Tab list all the objects created during the lifetime of the application and right side of that panel contains some additional filters, statistics including memory allocated, objects allocated, live objects, private bytes, virtual bytes and working sets
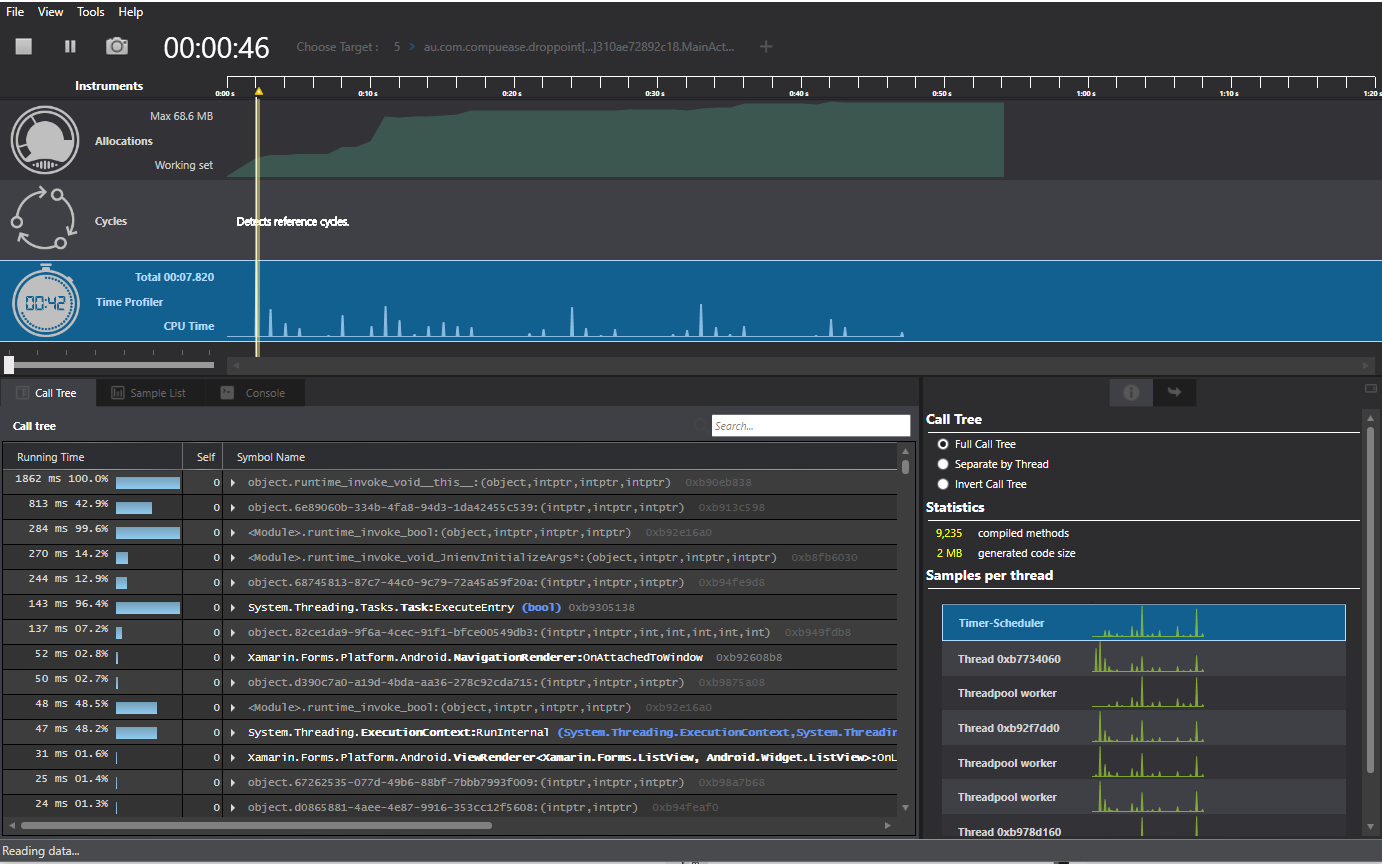
Call Tree tab display entire tree of all threads in the application and includes information about the memory allocated on each node. This also allows drilling down more and exploring the memory allocation of sub nodes as well.
Snapshot is one of the cool feature available with Xamarin Profiler, which facilitate to view all the objects in any point of time. We can take snapshot during the profiling section and red lines in the time line indicated that the snapshot has been taken at time.
Time Profiler
The Time Profiler instrument measures exactly how much time is spent in each method of an application by using sampling technique. This helps the developers to understand where the application is taking load on the mobile.
Cycles
This will list of all the circular references between objects in your code. When one of cycle is selected, this will display the path the references follow, as most cyclic references are indirect. These types of cycles are important, because they prevent the objects being picked up by the garbage collector.
References
https://developer.xamarin.com/guides/cross-platform/profiler/
https://blog.xamarin.com/say-hello-to-the-xamarin-profiler/
https://www.chipsncookies.com/2016/diagnosing-memory-issues-with-the-xamarin-profiler/